Performance overview
Monitoring → Performance: browser transaction throughput and duration, Core Web Vitals on the overview, and links into traces, Discover, and logs.
Performance is the default Monitoring view for “is the frontend healthy?” You get fixed overview cards over browser transactions and Core Web Vitals, then drill into traces, Discover, or logs when you need samples.
Route: /projects/:id/monitoring/performance
UI: Monitoring → Performance
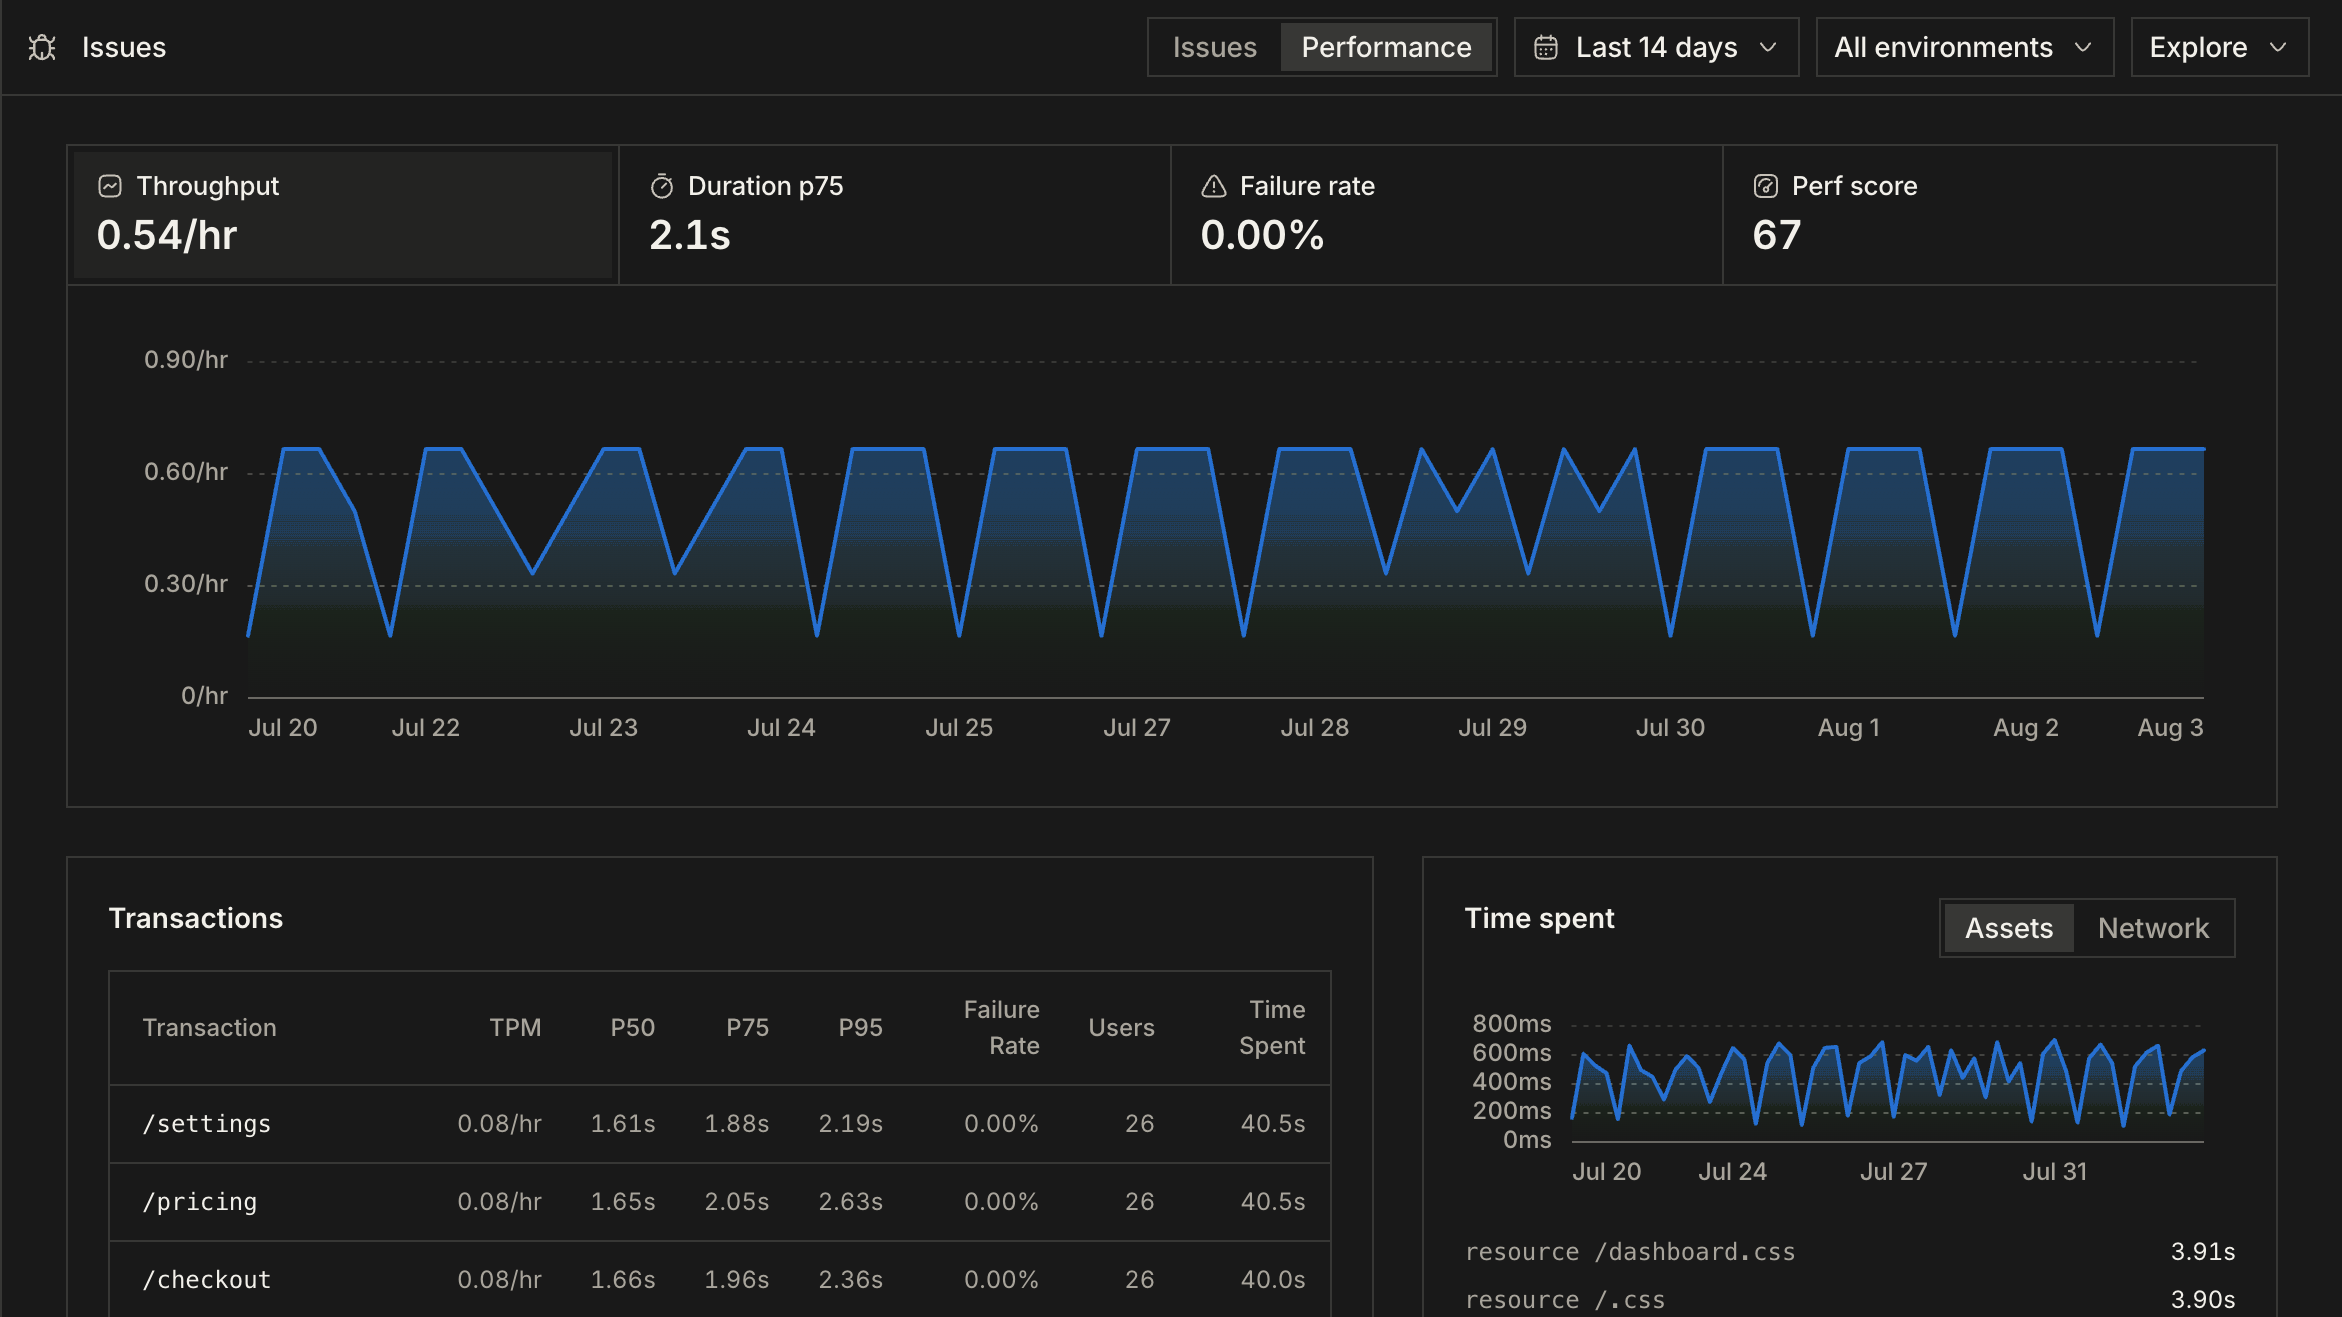
What you see
- Transaction throughput and duration (p50 / p75 / p95) over the Monitoring range.
- Core Web Vitals scores for the window (empty copy: No Web Vitals in this window.). There is no separate Web Vitals tab.
- Transactions table and time-spent breakdowns for assets and network.
- Entry points into Traces,
Discover, and
Logs via
?explore=.
Range pills live on the Monitoring shell (24h · 7d · 14d · 30d). Default is 14d so lightly trafficked projects still show span data.
When to open it
- A deploy might have slowed key routes.
- Dashboard traffic looks fine but users report jank.
- You need a sample waterfall or console log after an Issues spike.