Issues
Errors and friction grouped by cause, so you fix one problem instead of reading ten thousand events.
An issue is a bucket of events that share a cause. Ten thousand crashes from one bad deploy are one issue, not ten thousand rows — that grouping is the entire point of the page.
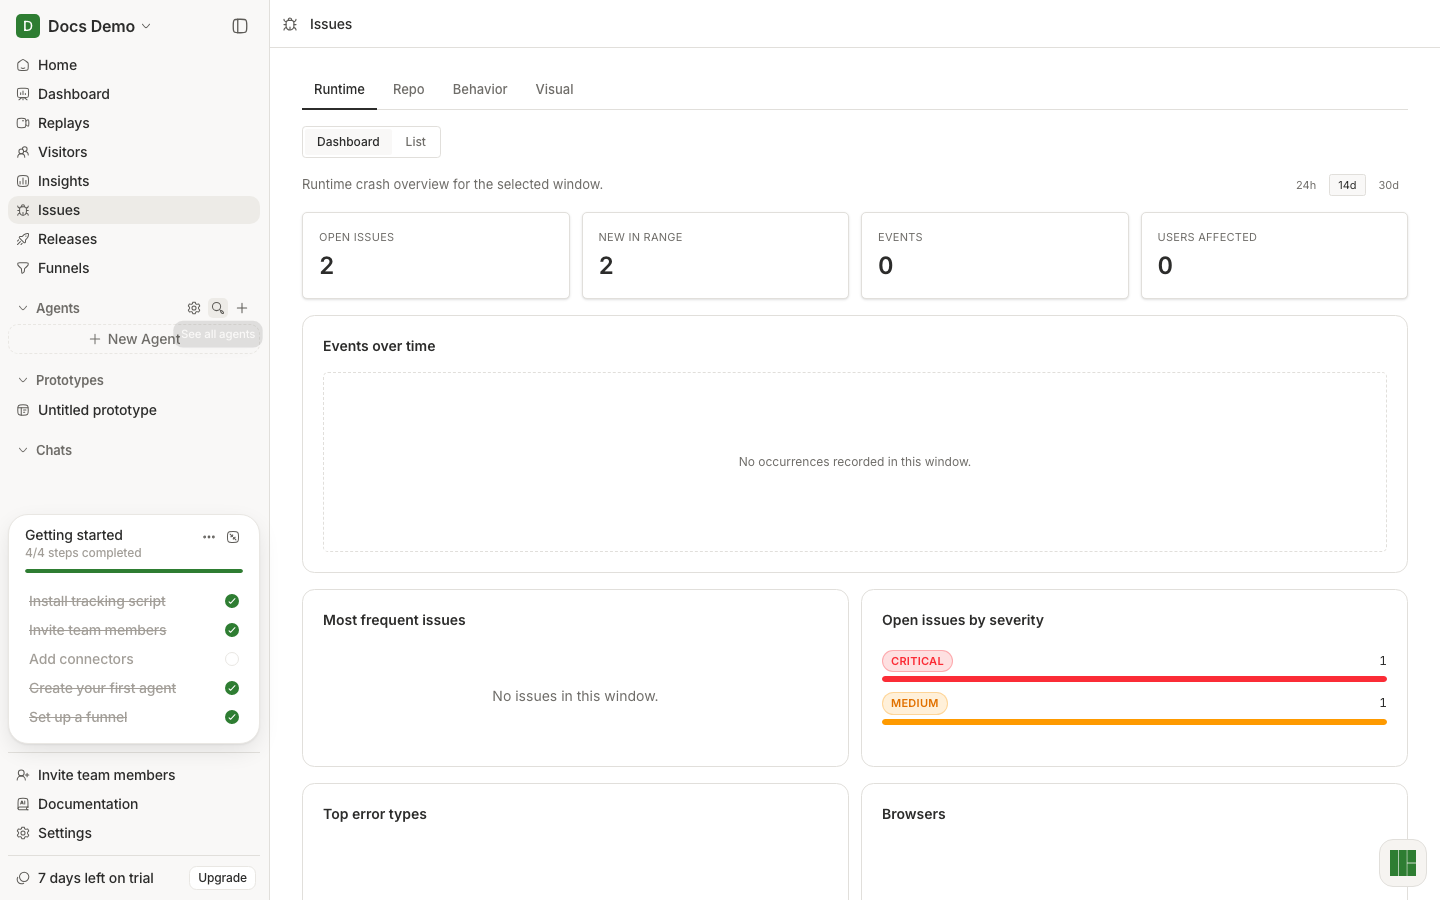
Four kinds of broken
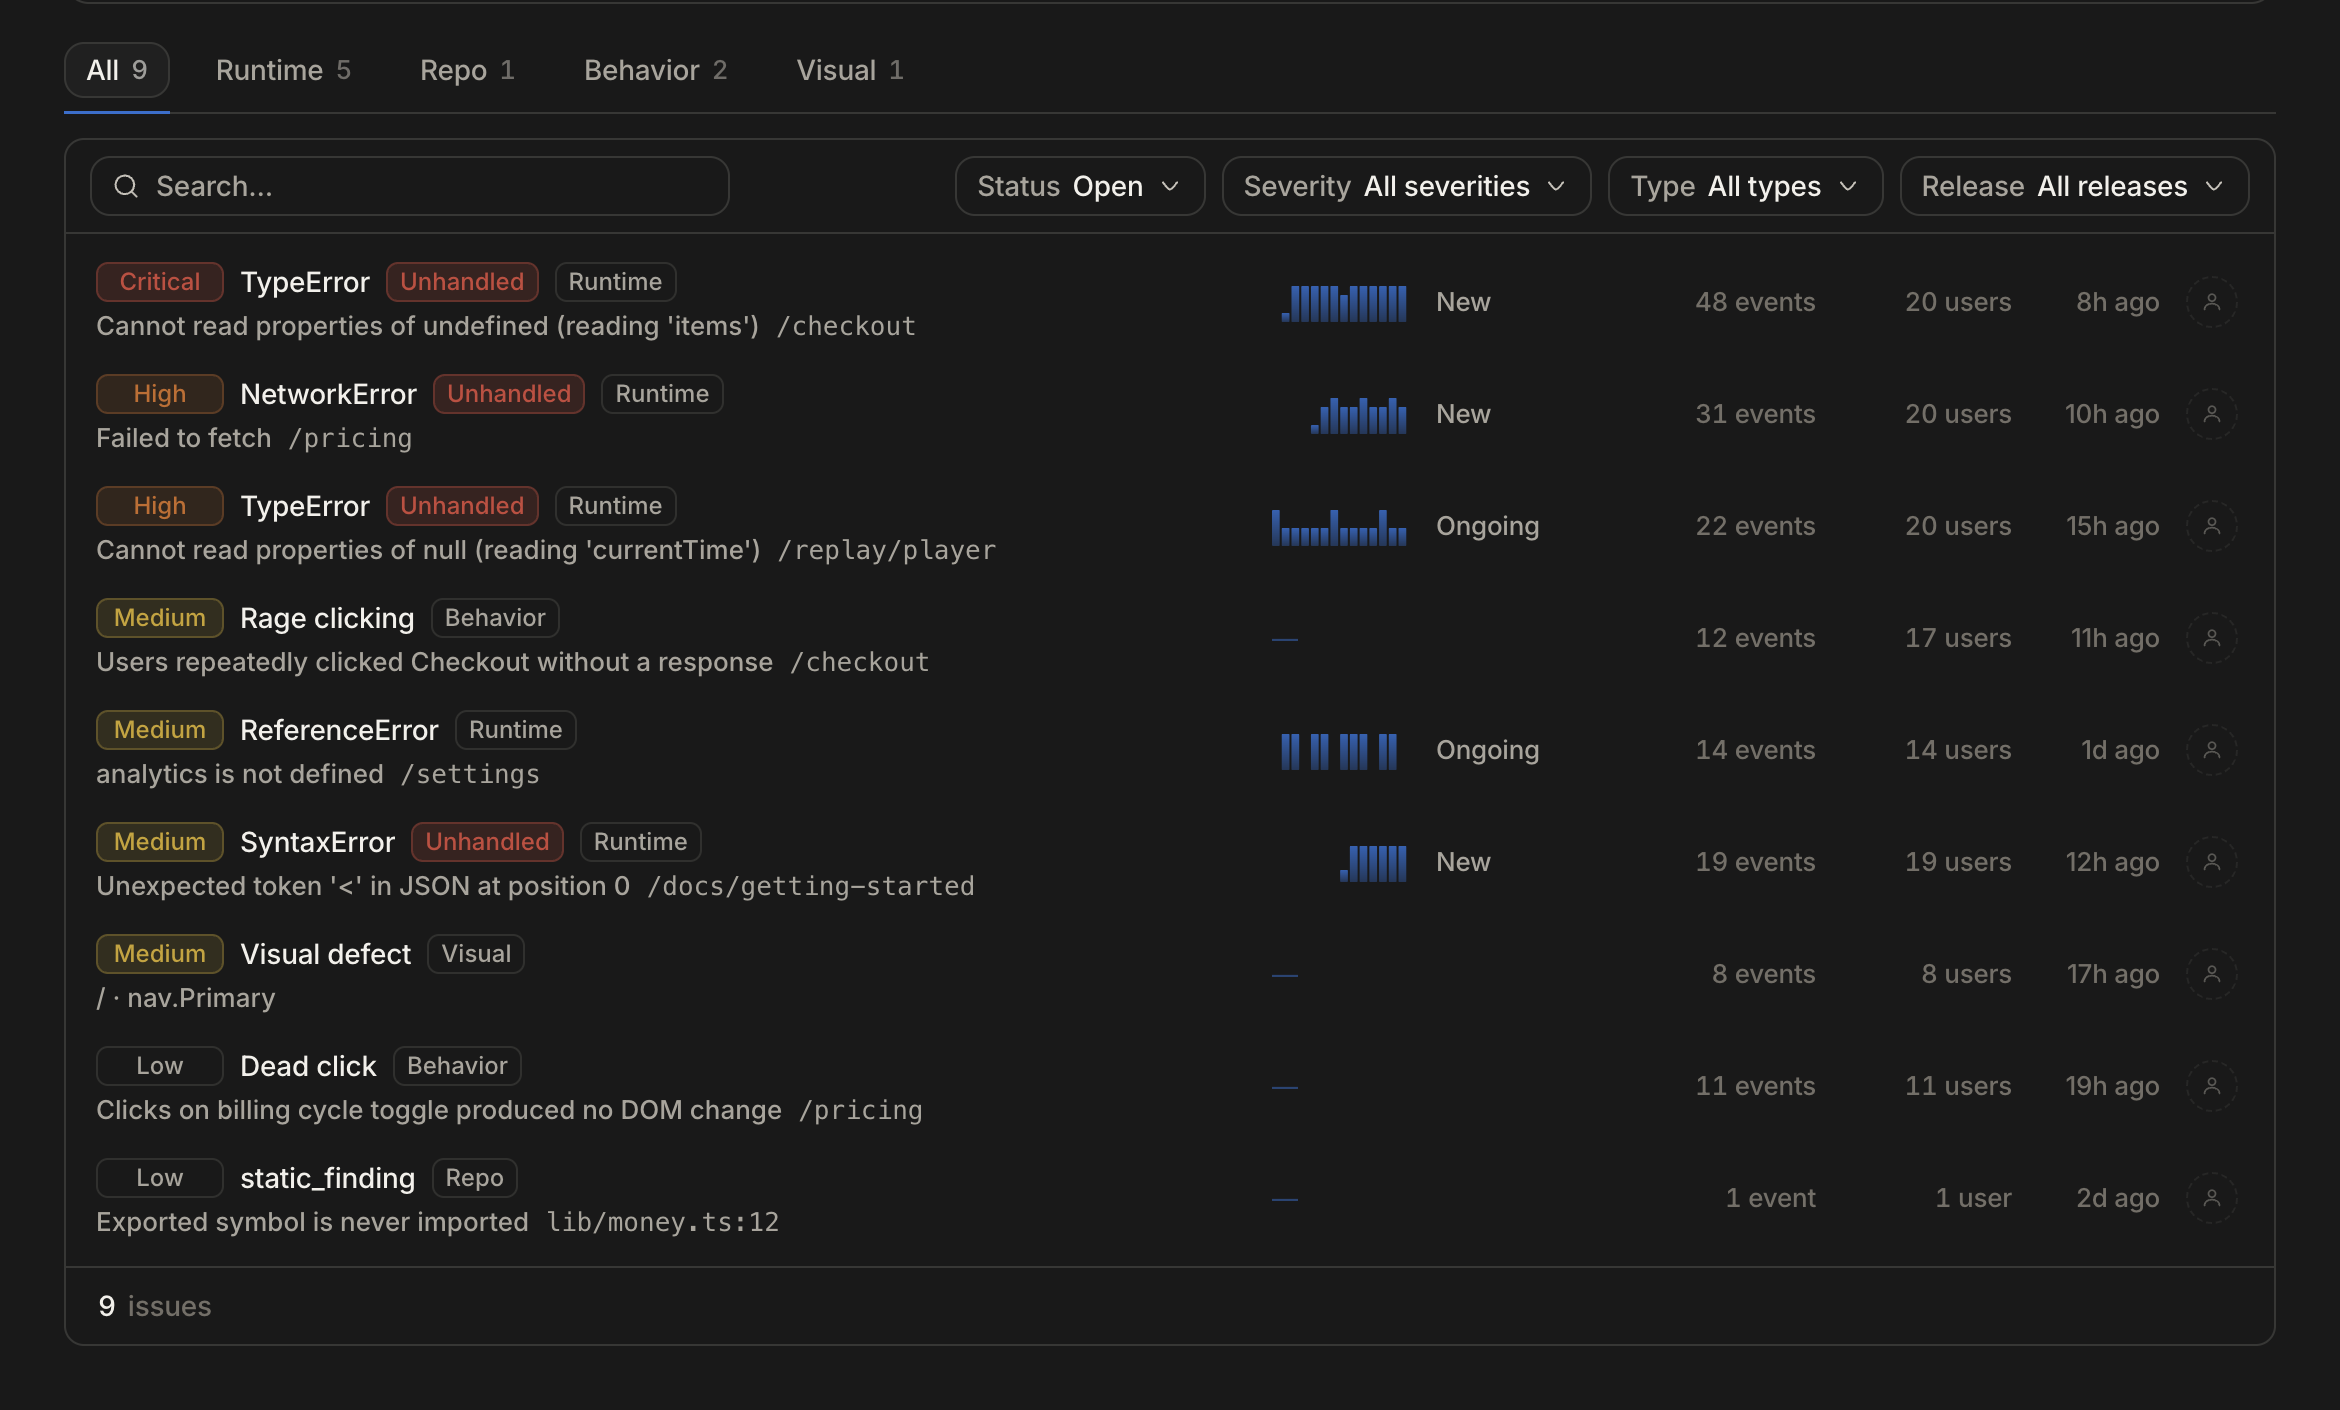
The tabs split issues by where the finding came from:
- Runtime — uncaught exceptions and unhandled rejections from the SDK.
- Behavior — friction derived from the replay rather than an error: rage clicks, unresponsive controls, abandoned forms, and stuck loading states. Nothing threw, but the user was clearly fighting the page.
- Visual — rendering defects found by grading the replay itself, such as overlapping or unreadable content that no exception would ever report.
- Repo — findings from scanning the connected repository.
Behavior and Visual are the ones a traditional error tracker cannot give you: a button that silently does nothing produces no stack trace, and a customer who gives up rarely files a ticket.
Read a row before you open it
Each row carries the shape of the problem: severity, whether it was handled, the message and the path it happened on, a sparkline of recent volume, whether it is New or Ongoing, and how many events and distinct people it has touched.
That is usually enough to rank. 20 users on a New critical issue is a different morning than 2 users on something ongoing for a month.
From an issue to the cause
The affected replays are attached to the issue. Open one and you are watching the session that produced the error, with the console and network record from that moment — see Replays.
For a readable stack trace pointing at your source rather than a minified bundle, upload source maps. See Errors.
When you find yourself triaging the same class of thing every week, hand it to an agent.