Performance
How fast your pages actually are for real users, and which route is spending the time.
Performance sits beside Issues in the same monitoring view, because slow and broken are the same question asked twice. Everything here comes from the install — no extra instrumentation, no synthetic test runs.
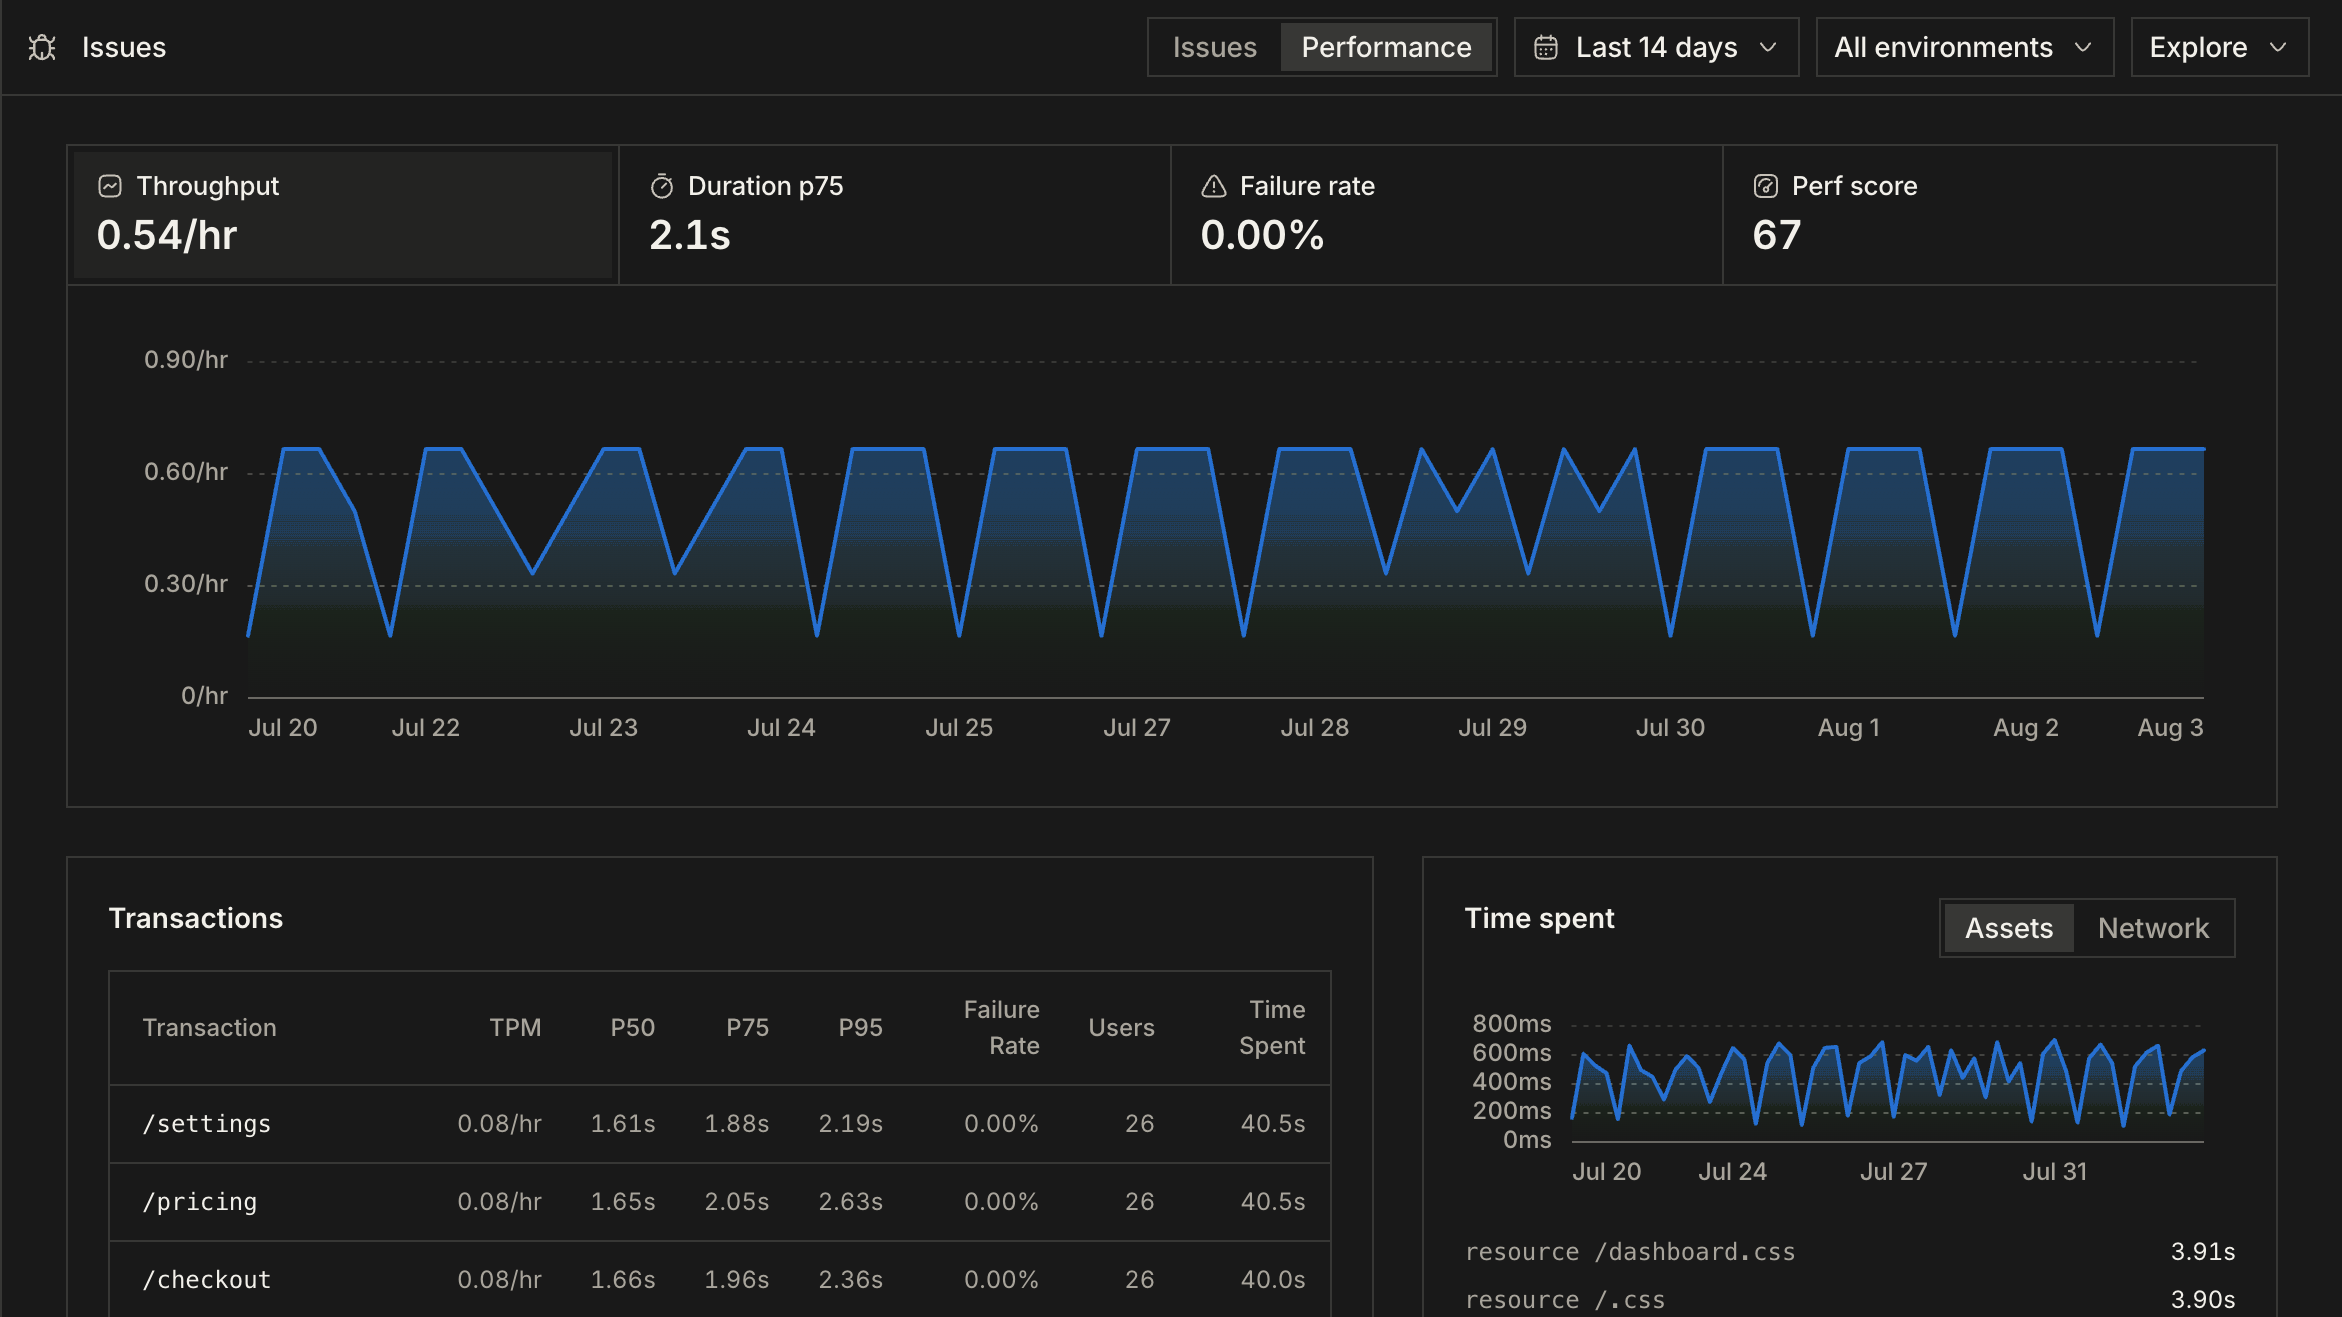
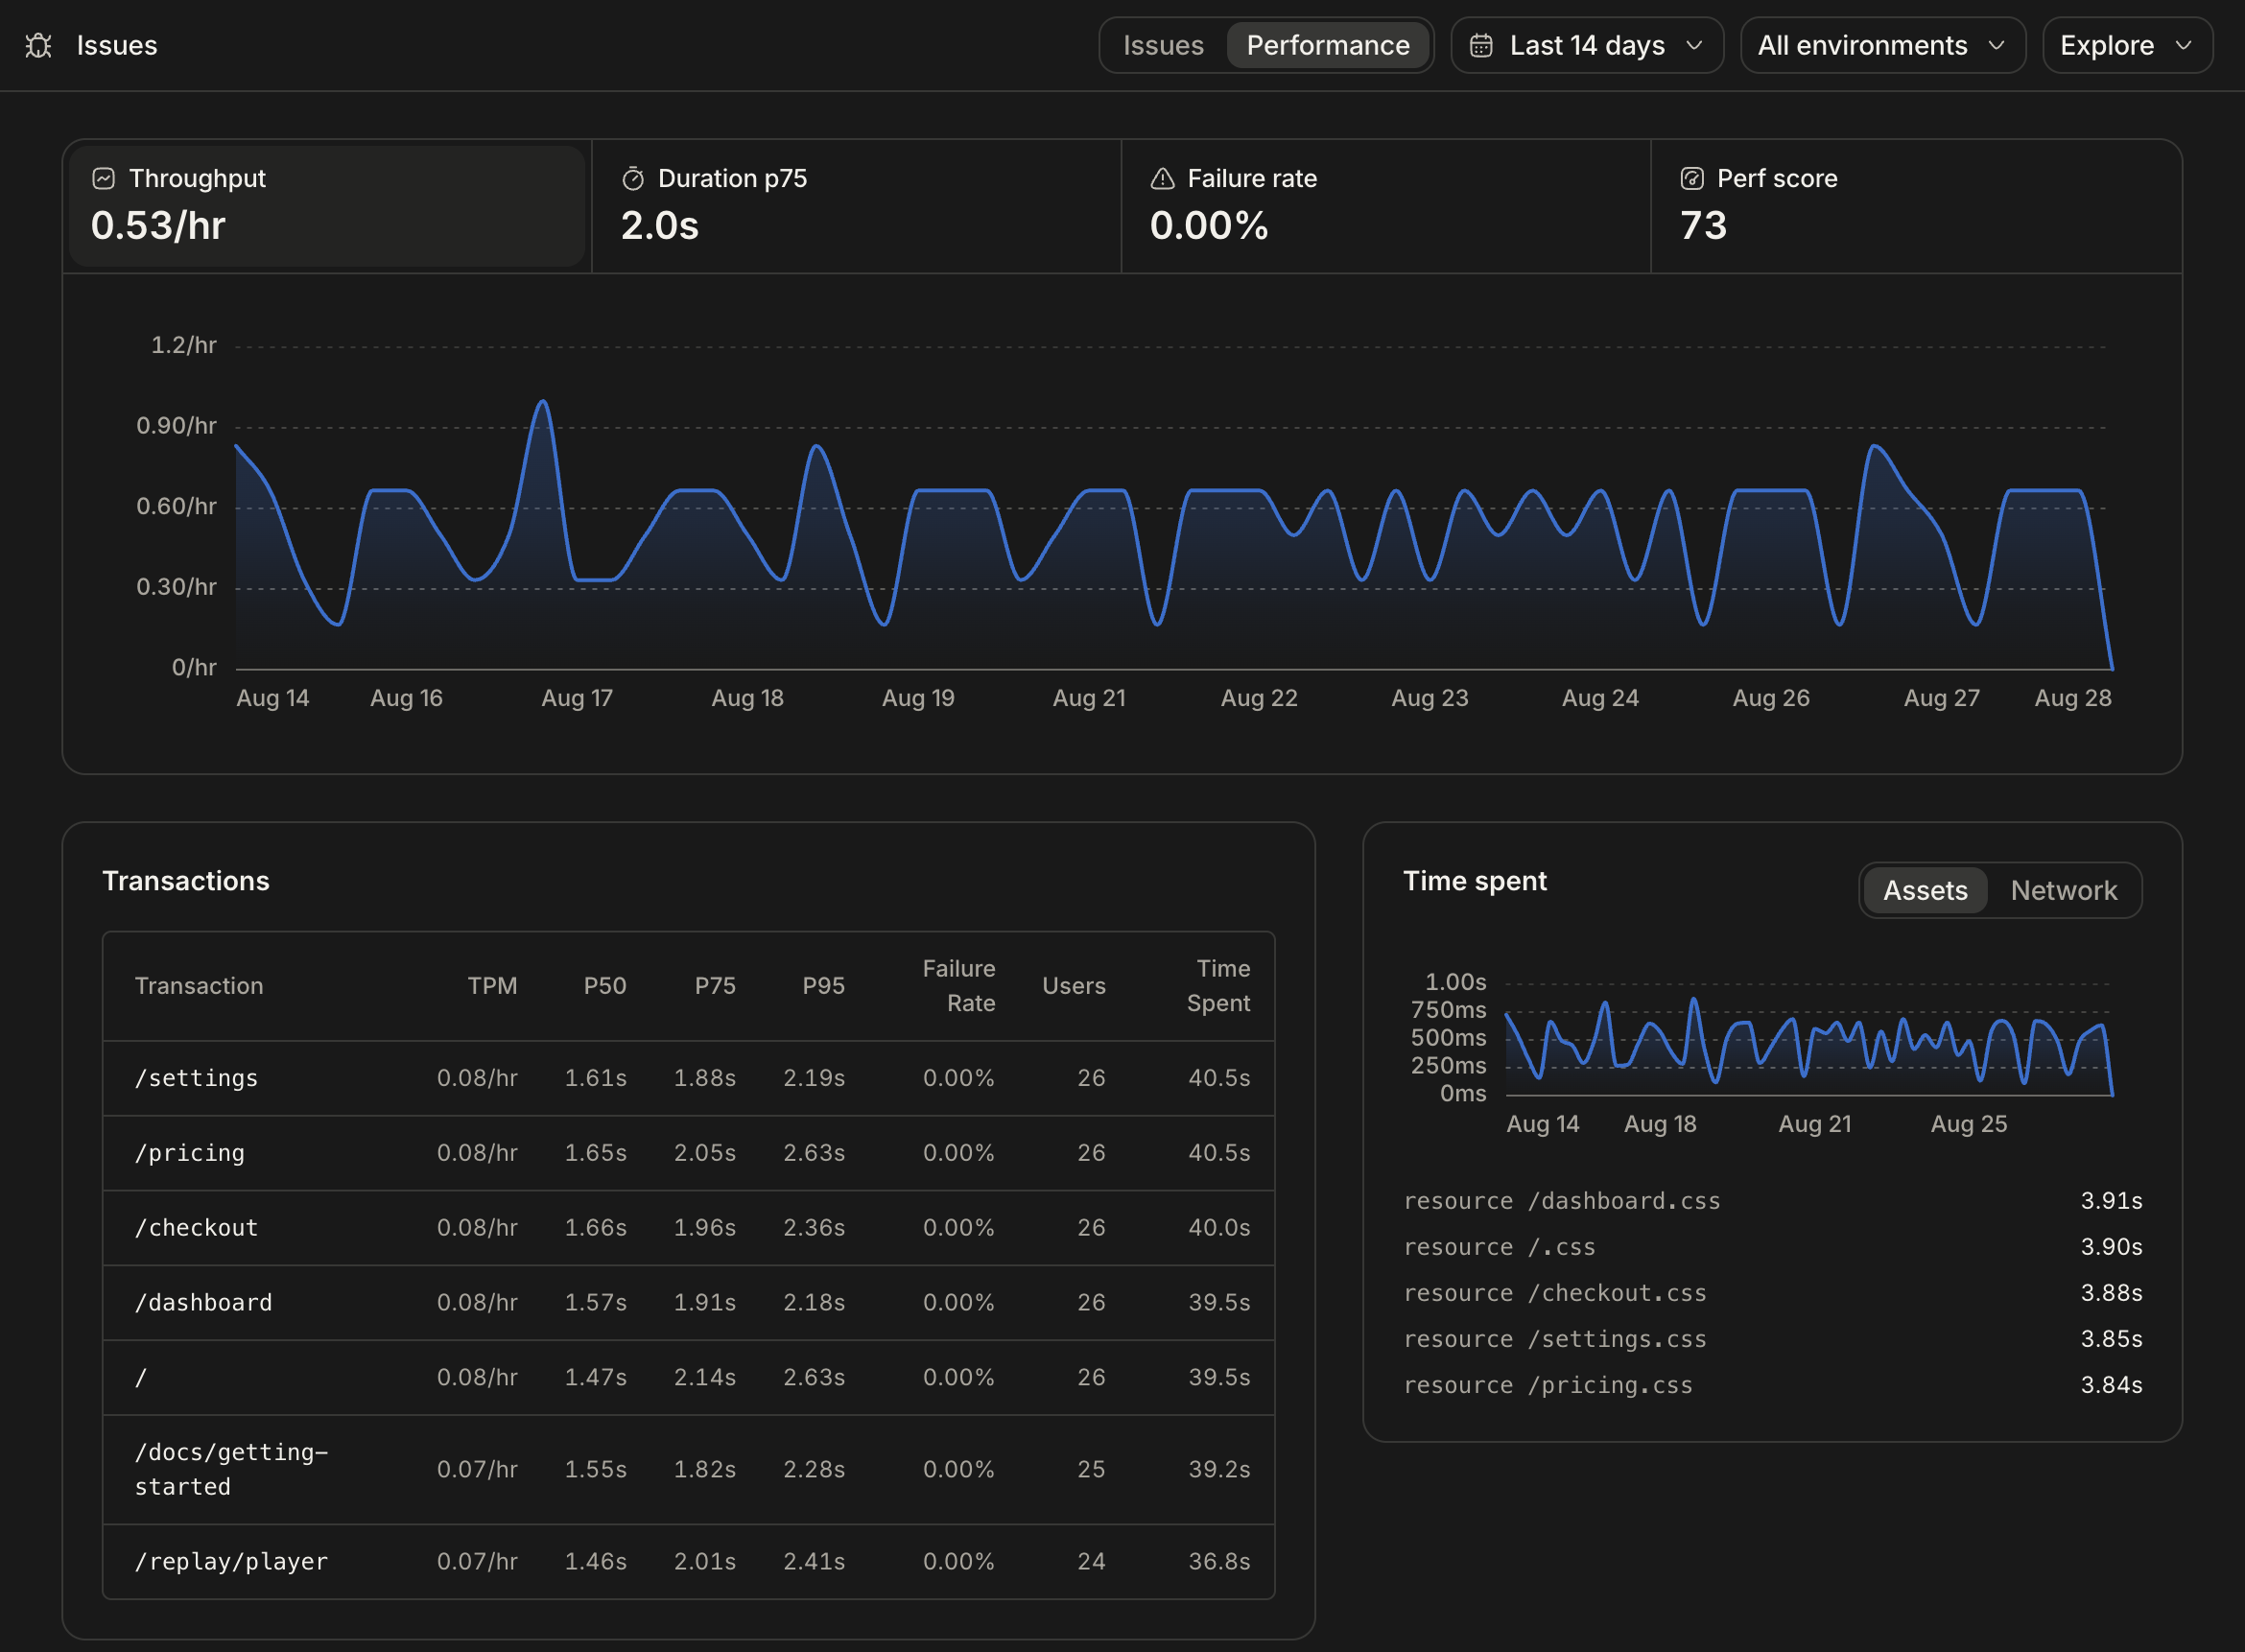
The four numbers at the top
- Throughput — how many page loads you are serving over the range.
- Duration p75 — the 75th percentile load, not the average. A mean hides the slow quarter, and the slow quarter is the part people complain about.
- Failure rate — the share of those loads that failed.
- Perf score — a single 0–100 rollup of your Core Web Vitals.
Transactions is the part you act on
The table lists routes with TPM, P50, P75, P95, failure rate, users, and time spent. Sort by time spent rather than by p95: a route that is slightly slow for everyone usually costs more total human time than a route that is very slow for four people, and it is the one worth fixing first.
Time spent on the right splits that time into Assets and Network, down to the individual resource. A stylesheet taking 3.9s is a different fix than an API call taking 3.9s, and this is where you tell them apart.
Core Web Vitals
FCP, LCP, CLS, INP, and TTFB are collected from real sessions and are what the
Perf score summarises. They arrive with enableWebVitals, which is on by default
— see the SDK options if you need to turn it off.
Going deeper
Explore opens three views over the same data: Traces for individual page-load spans, Discover for querying the raw events, and Logs for what the SDK captured from the console.
The date range and environment filters at the top govern the whole page, so you can narrow to one environment before reading any of these numbers.