Logs
Console warn/error log explorer: search, level filter, ranges, table columns, Watch replay links, and empty states.
Logs searches console warn and error messages the SDK already ships into the project logs store. It is a project-wide explorer — not a single-session activity tab (for that, use the replay player).
Tab: Insights → Logs
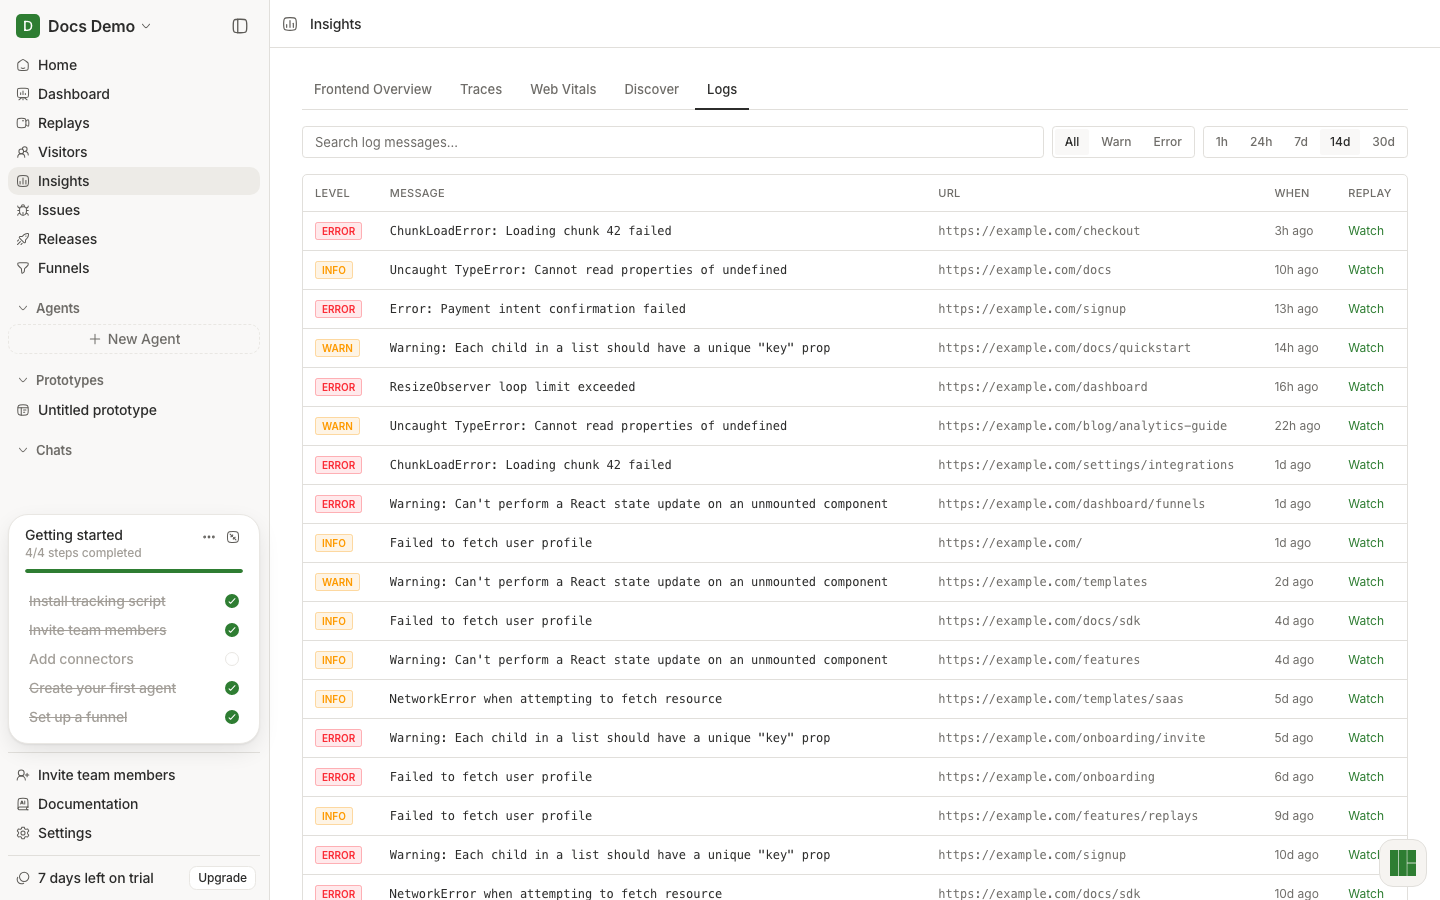
Controls
All on one toolbar row:
| Control | Values / behavior |
|---|---|
| Search | Placeholder Search log messages… — debounced 300ms, sent as q |
| Level | All · Warn · Error (default All) |
| Range | 1h · 24h · 7d · 14d · 30d (default 14d) |
Request: GET /api/projects/:id/logs?range=&level= (+ optional q).
Results table
Shown when at least one log returns. Columns:
| Column | Content |
|---|---|
| Level | Badge (error red / warn amber), uppercase |
| Message | Mono, clamped to 2 lines |
| URL | Page URL or — |
| When | Relative: just now / Nm ago / Nh ago / Nd ago |
| Replay | Watch → /projects/:id/replays?replay=<sessionId>&t=<timestampMs> when sessionId present; else — |
Empty / loading
- Loading with no rows yet: pulse skeleton
- Empty: dashed panel No logs in this window.
Requirements
- SDK console capture must be enabled / not filtered out of warn/error levels
- Beware secrets in console output — see Privacy
Developer guide: Console & network capture.
Beginner gotchas
- info/debug console lines are not what this explorer is built for — filters are All / Warn / Error.
- Search is substring on the message; widen range before concluding “no logs.”
- Watch jumps to the replay at the log timestamp when a session is attached.
- Tab choice is not deep-linkable.