Web Vitals
Performance Score donut, per-vital p75 tiles, score distribution, worst pages by metric, ranges, and empty copy.
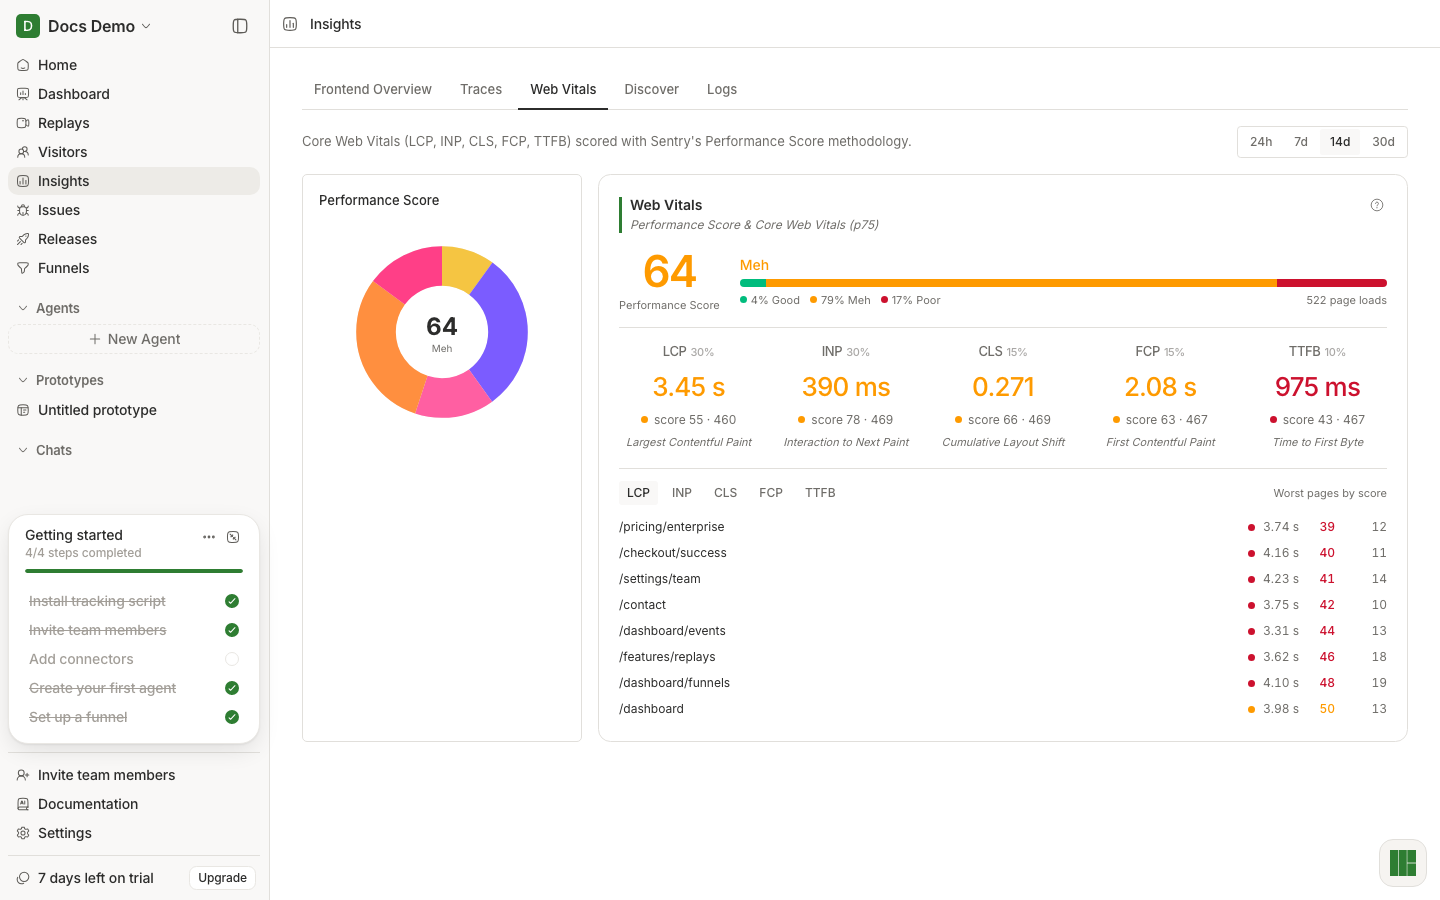
Web Vitals shows real-user Core Web Vitals and a blended Performance Score (0–100) for the selected window. The Insights tab self-fetches the dedicated web-vitals API and pairs a donut with the shared WebVitalsCard breakdown used on the Dashboard.
Tab: Insights → Web Vitals
Subtitle in UI: describes Core Web Vitals (LCP, INP, CLS, FCP, TTFB) scored into a blended Performance Score.
Range
Pills: 24h · 7d · 14d · 30d
(No 1h on this tab.)
Default: 14d.
Request: GET /api/projects/:id/web-vitals?startDate=&endDate= (ISO window computed from the pill).
Layout
Left — Performance Score donut
Card title: Performance Score
- Weighted arcs for TTFB · LCP · FCP · INP · CLS
- Center: overall score number + rating label
- Ratings from score: Good (≥90) · Meh (≥50) · Poor (<50) · No data (null)
Tooltip per segment: p75, Score, Weight %.
Empty: No Web Vitals recorded in this window.
Loading: Loading…
Right — Web Vitals card
Card title / subtitle: Web Vitals / Performance Score & Core Web Vitals (p75)
Help popover explains the 0–100 blend across LCP, INP, CLS, FCP, TTFB; green 90+, yellow 50–89, red under 50.
When samples exist:
- Overall score (large) + rating + score distribution stacked bar (Good / Meh / Poor % of page loads, total page loads count)
- Per-metric tiles (order from API summary): metric code, weight %, p75 value, score · sample count, full name
- LCP — Largest Contentful Paint
- INP — Interaction to Next Paint
- CLS — Cumulative Layout Shift (unitless; others in ms/s)
- FCP — First Contentful Paint
- TTFB — Time to First Byte
- Worst pages by score — metric tabs LCP · INP · CLS · FCP · TTFB (default LCP). Up to 8 paths sorted by lowest score. Each row: path, rating dot, p75, score, samples.
Empty (card body): No Web Vitals captured in this window.
Per-metric pages empty: Not enough per-page samples for {metric}.
How to use after a deploy
- Stamp a release in the SDK.
- Open Web Vitals on 7d or 14d so enough page loads accumulate.
- Watch overall score and the Good/Meh/Poor distribution shift.
- Use Worst pages for the vital that regressed; open Replays / Traces on those routes.
Data requirements
Needs Web Vitals samples from the SDK — not pageviews alone. See SDK web vitals & tracing.
Beginner gotchas
- Insights Frontend Overview does not embed this donut; use this tab (or Dashboard’s Web Vitals card) for vitals.
- Short windows on low traffic show No Web Vitals recorded / captured in this window.
- CLS is unitless; do not compare its p75 to LCP milliseconds.
- Tab selection is not in the URL — refresh returns to Frontend Overview.