Explain a traffic or conversion dip
Start from Dashboard, narrow with pages or Funnels, then prove the story in Replays instead of guessing from a chart.
Charts tell you something moved. This guide gets you from a Dashboard pulse to a concrete user story in Replays (and optionally Visitors) so you can act.
Before you start
- Data is flowing (verify).
- You have a question like “signups fell” or “this page died yesterday,” not “show me every KPI definition.”
Read the pulse on Dashboard
Open Dashboard. Set the range to the window you care about (Today, Last 7 days, or a custom range). Look at Visitors, Sessions, and the breakdown that matches your question — usually Pages, Events, or Sources.
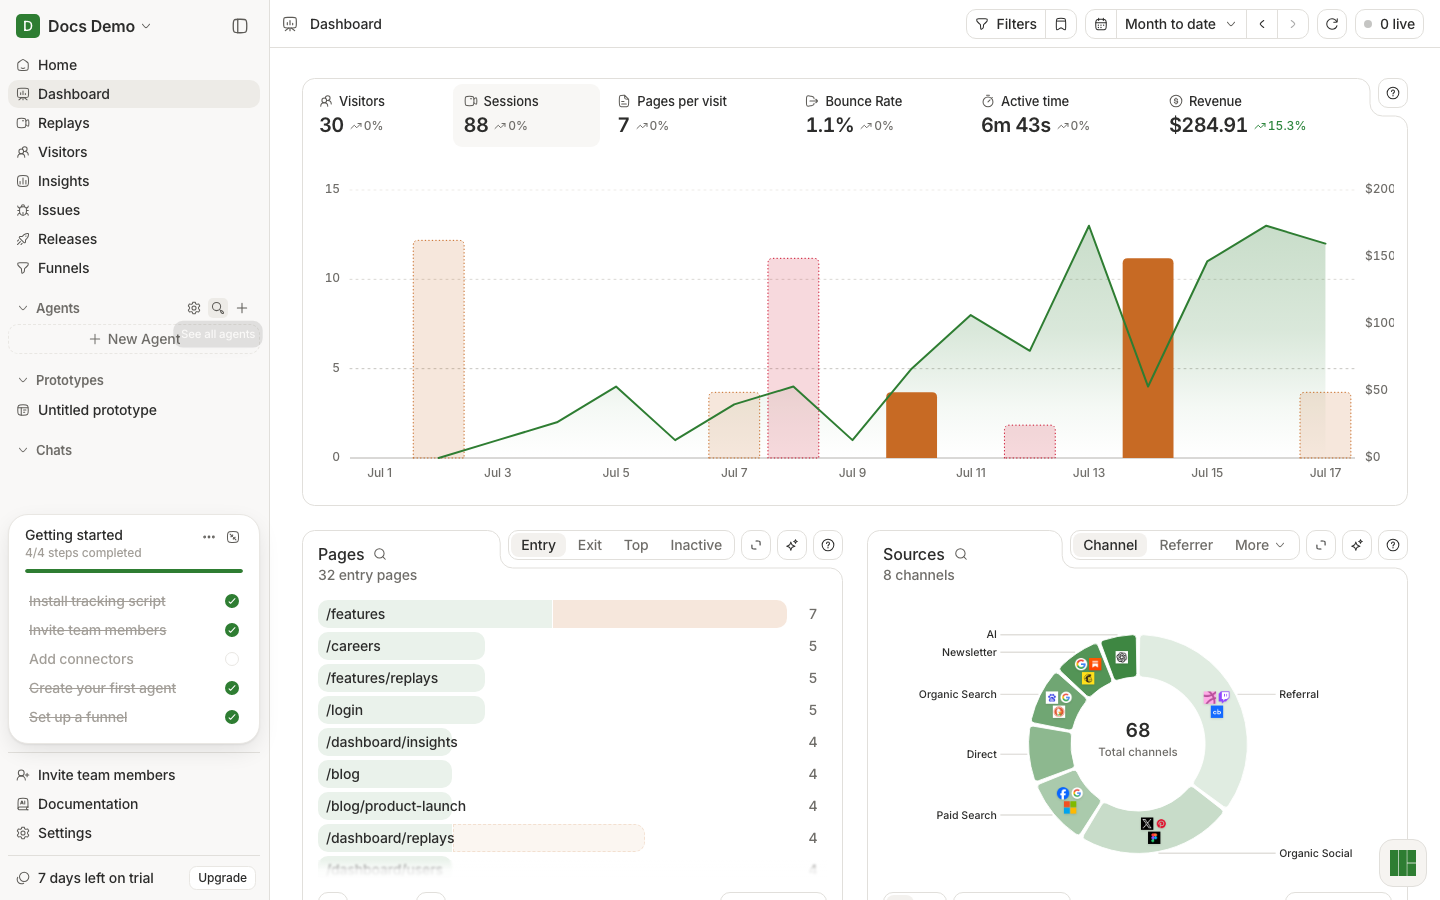
Write down one specific dip: which metric, which page or event, which range.
Narrow with Funnels when the job is conversion
If the question is a multi-step conversion (signup, checkout, activation), open Funnels. Build or select a funnel that matches those steps for the same range. Find the step with the largest drop.
You do not need a perfect funnel on day one — a two or three step funnel that matches your product language is enough to aim Replays.
Prove it in Replays
Open Replays with the same date range (and page/event filters if you have them). Watch two or three sessions that hit the failing step or page.
Use the watch a session habit: activity panel open, pause on the struggle, note whether it is UX, an error, or slow network.
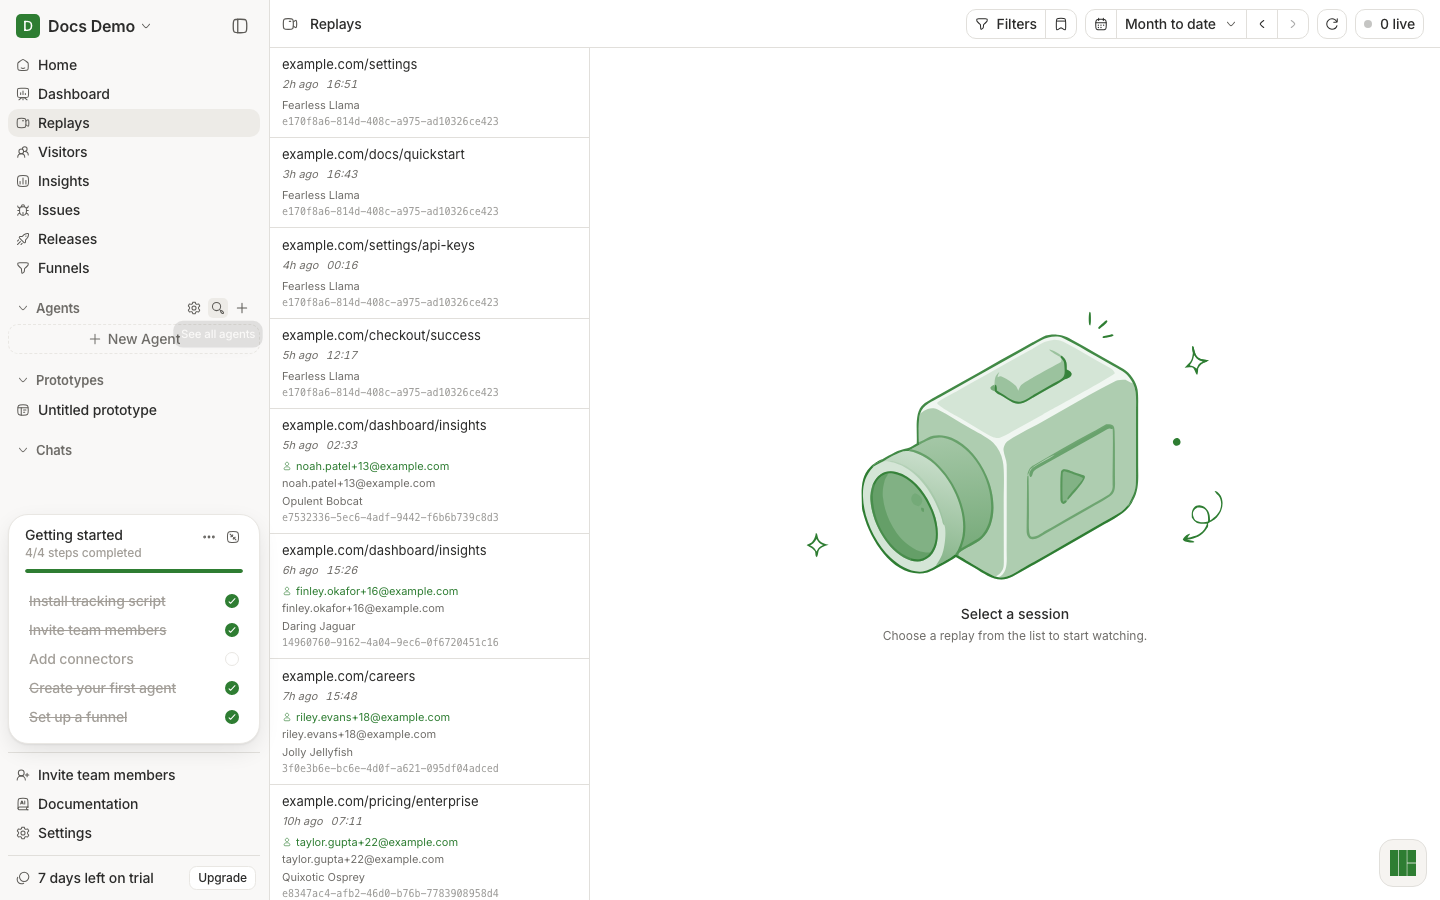
Optional: open a Visitor from a replay if you need identity or multi-session context (Visitors).
What good looks like
- You can say: “Metric X dropped in range Y because users on page/step Z hit [error / confusion / exit],” with at least one replay as evidence.
- You know whether the next move is a product fix, an Issue to triage, or more instrumentation (identify and events).
If it did not work
- Dashboard empty — install/verify first.
- Funnel empty — you need the custom events or page views that define steps.
- Replays do not match the chart — check you copied the same range and filters; Releases-only pills do not share Dashboard range state.
Next
Ask Home, then verify to draft the narrative faster, still following citations into Dashboard and Replays.